
How to Calculate Churn Rate from Stripe Data
Oct 5, 2026 · Matt
Churn is the metric founders quote most confidently and measure least consistently. "We're at 3% churn" — 3% of what, over what period, counting which cancellations? Two companies with identical Stripe accounts can publish very different churn rates simply because they defined the calculation differently.
Stripe's own Billing dashboard reports churn against one set of definitions — subscriber churn, gross and net MRR churn, even retention cohorts — and it's a genuinely useful starting point. But those definitions are Stripe's, not necessarily yours. The moment you need churn on your own terms — a different denominator, your MRR definition, your customer segments — you're back to first principles. That last mile is business logic you supply.
This post covers the churn rates that actually matter, where Stripe data trips people up, and how to calculate a version you can stand behind.
Customer churn and revenue churn are not the same number
The first fork in the road: are you counting logos or dollars?
Customer churn is the percentage of customers who canceled in a period. Lose 5 of 100 customers and that's 5% customer churn — regardless of whether they were your biggest accounts or your smallest.
Revenue churn is the percentage of recurring revenue you lost. Lose one $2,000/month customer out of $50,000 total MRR and that's 4% revenue churn from a single logo.
These can point in opposite directions. A month where you lose ten tiny accounts but zero big ones has high customer churn and low revenue churn. Reporting only one hides half the story, and choosing the flattering one is how teams quietly mislead themselves.
Churn is measured against your recurring revenue base, so consistent revenue definitions matter before you start — see Monthly vs Quarterly Revenue in Stripe: What Actually Counts.
The formulas
Customer churn rate = customers lost during the period ÷ customers at the start of the period
Gross revenue churn = MRR lost to cancellations and downgrades ÷ MRR at the start of the period
Net revenue churn = (MRR lost − MRR gained from expansion) ÷ MRR at the start of the period
That third one matters. Net revenue churn can be negative — meaning existing customers expanded more than others canceled. Negative net churn (or net revenue retention above 100%) is one of the strongest signals in SaaS, and you can only see it if you're tracking expansion alongside losses.
Where Stripe data trips people up
1. Failed payments aren't churn — yet. A subscription goes past_due when a card fails, but the customer hasn't left. Many recover through retries (dunning). Count every failed payment as churn and you'll overstate it badly. Count the eventual involuntary cancellation, after retries are exhausted, as the churn event.
2. The denominator is a choice. Churn at the start of the period vs. the average over the period gives different rates. Neither is wrong, but mixing them month to month makes your trend meaningless. Pick one and hold it.
3. Downgrades hide in plain sight. A customer who drops from $500 to $100/month didn't cancel, so customer churn ignores them entirely — but you lost $400 of MRR. Revenue churn only catches this if you're comparing each subscription's value across periods, not just looking at cancellations.
4. Snapshot data can't reconstruct history. As with MRR, querying Stripe subscriptions today shows their current state. To know who was active last month and at what value, you need point-in-time data built from invoices and subscription events — not a single live snapshot. (More on this limitation in Why Stripe's Native Reports Break Down as Your Business Scales.)
5. Annual plans stretch the window. An annual customer can only "churn" at renewal. If you measure monthly, they look perfectly retained for eleven months and then can swing your churn in month twelve. Cohort-based churn handles this far better than a flat monthly rate.
A worked example
Start of month: 100 customers, $50,000 MRR. During the month:
Event | Customers | MRR impact |
|---|---|---|
4 customers canceled | −4 | −$1,800 |
2 customers downgraded | 0 | −$600 |
3 customers expanded | 0 | +$1,400 |
Card failures recovered | 0 | $0 |
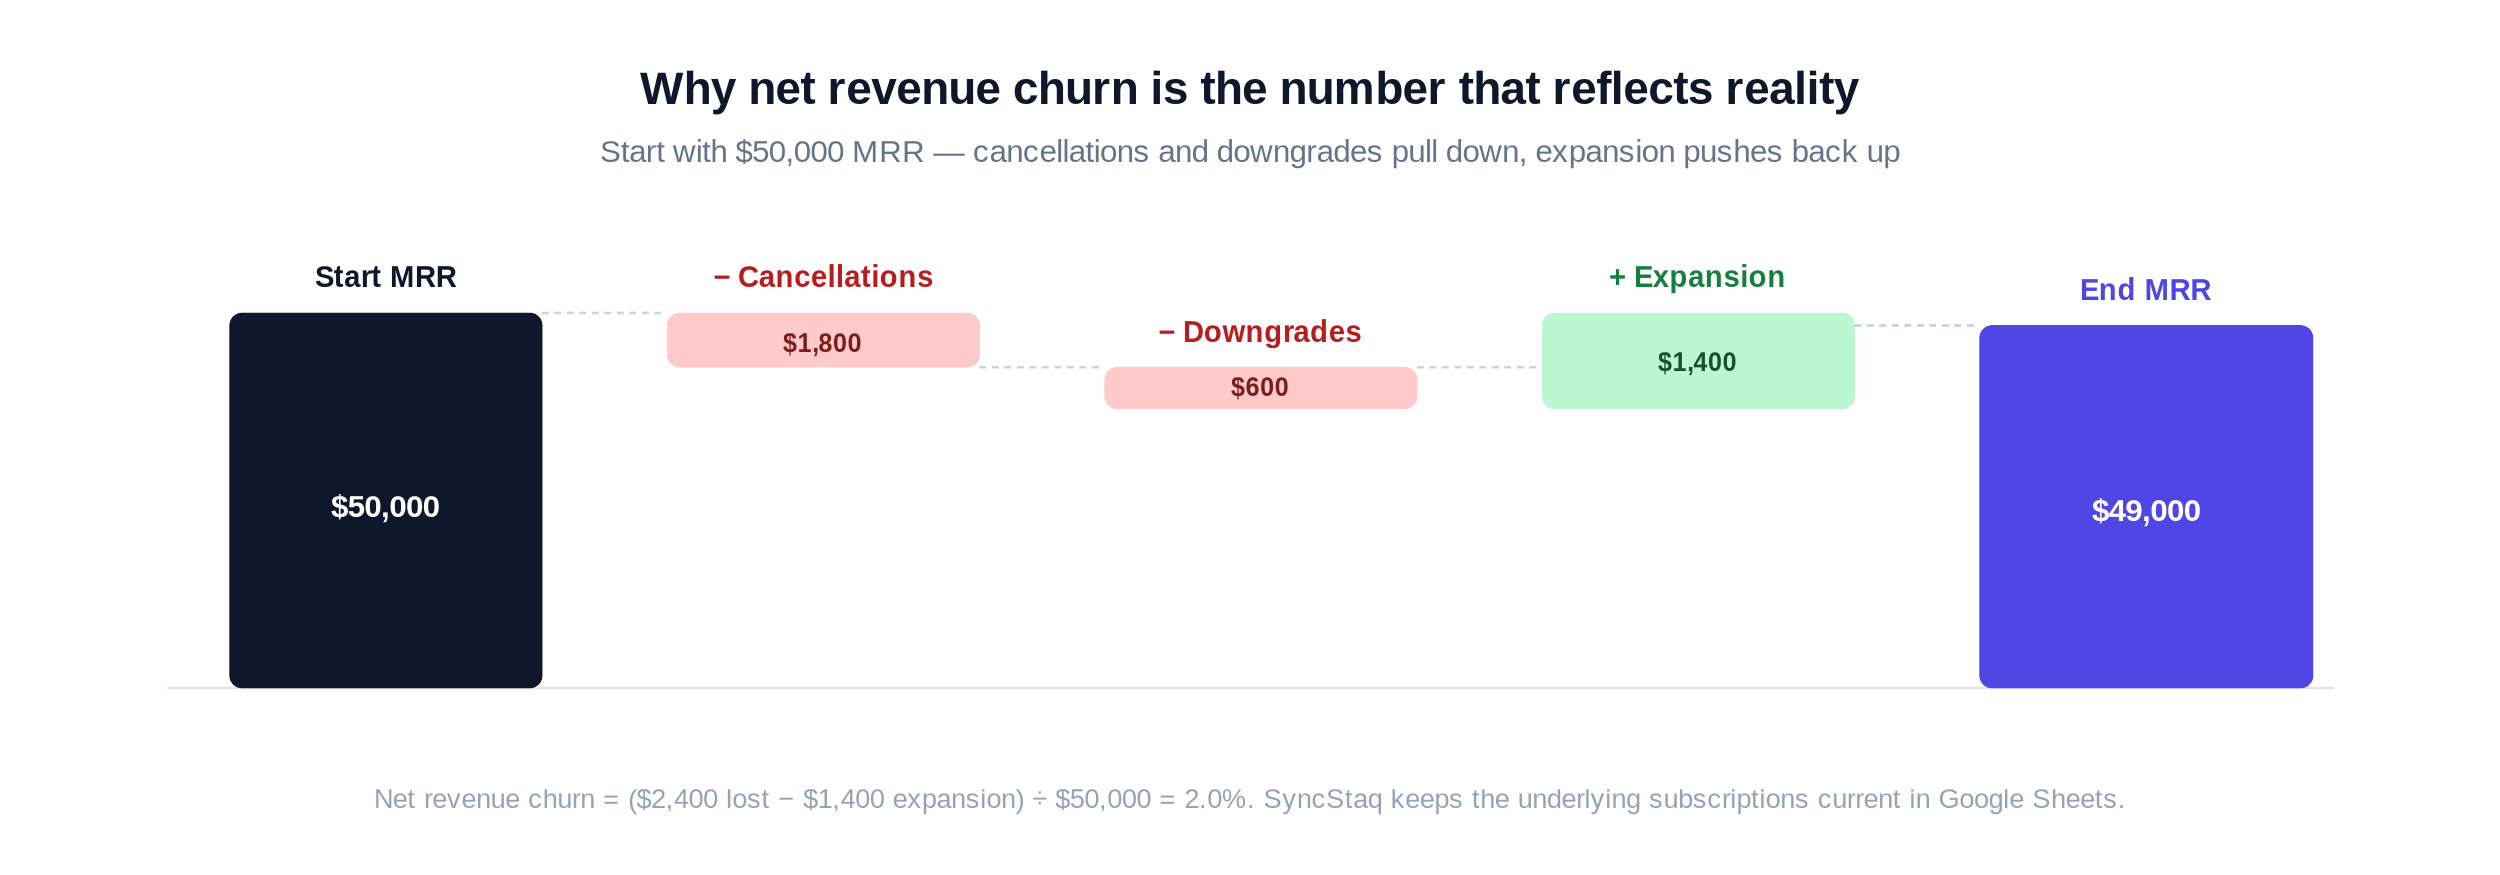
Net revenue churn nets expansion against losses: ($2,400 − $1,400) ÷ $50,000 = 2.0%.
Customer churn = 4 ÷ 100 = 4.0%
Gross revenue churn = ($1,800 + $600) ÷ $50,000 = 4.8%
Net revenue churn = ($2,400 − $1,400) ÷ $50,000 = 2.0%
Three legitimate churn numbers — 4.0%, 4.8%, 2.0% — from one month of data. If you don't say which one you mean, "our churn is 2%" and "our churn is nearly 5%" are both technically true. That ambiguity is exactly why churn needs a written, repeatable definition.
Why a spreadsheet is the right tool
Stripe Billing's dashboard actually does compute churn — subscriber churn, churned revenue, gross and net MRR churn, even subscriber- and revenue-retention cohorts. For a quick read, it's genuinely useful, and it's the first place to look. (Those analytics ship with Stripe Billing, a paid add-on — roughly 0.7% of billing volume on top of standard processing fees — so factor that in when you weigh tools.) Where it stops is control: you can't change how churn is defined (the denominator, whether failed payments count, how downgrades are treated), reconcile it against your own MRR definition, segment it by the dimensions you care about, join it to non-Stripe or business context, or audit the exact customers and invoices behind a number — and it only sees Stripe Billing subscriptions, not invoice-based or one-off revenue.
A Google Sheet gives you that control and traceability — provided the underlying Stripe data is current and complete. The recurring pain isn't the analysis; it's re-exporting subscriptions, invoices, and events every month and stitching them into a history you can trust.
A setup that gives you honest churn
Keep Stripe subscriptions, invoices, and line items synced into Google Sheets so the source billing data stays current. For point-in-time churn movements, maintain period snapshots or an event-derived history in your working sheet.
Report customer churn and revenue churn side by side, and gross next to net, so no single number can mislead.
Define your denominator and your churn event once (start-of-period base; involuntary churn counted after dunning) and apply them every period.
Track expansion explicitly so you can compute net revenue retention, not just losses.
Cohort your annual plans instead of forcing them into a monthly rate.
Get the data current and the definitions fixed, and churn stops being a talking point you can flex and becomes a metric you can actually manage.
Stop rebuilding churn analysis from CSV exports. SyncStaq keeps your Stripe subscriptions, invoices, and line items synced into Google Sheets every hour, giving you a current billing-data base for customer and revenue churn analysis. See how the Stripe → Sheets sync works, or start a 14-day free trial.
Related reading: How to Track Failed Payments and Recover Involuntary Churn from Stripe and How to See Total Revenue by Customer in Stripe.